
Extraordinary Investigator Ms. Milla
Exploring the Asian Drama Dataset
Exploring the My Drama List Data Set
If you’re caught up on my previous post, Crash Landing on Data, you’ll know that we just spent a lengthy amount of time scraping data from MyDramaList.com. Now it’s finally time to dive into data and see what mysteries we can unfold! (The title of this blog references another popular K-Drama titled “Extraordinary Attorney Woo”)
This blog will explore the following questions:
- How do viewer scores compare across genres?
- What’s the most popular genre?
- How do viewer scores compare across streaming platforms?
- What’s the most popular streaming service?
- What’s the relationship between show length and viewer score?
- Did viewership increase during/after COVID-19?
- Which country produces the best dramas?
How do viewer scores compare across genres?
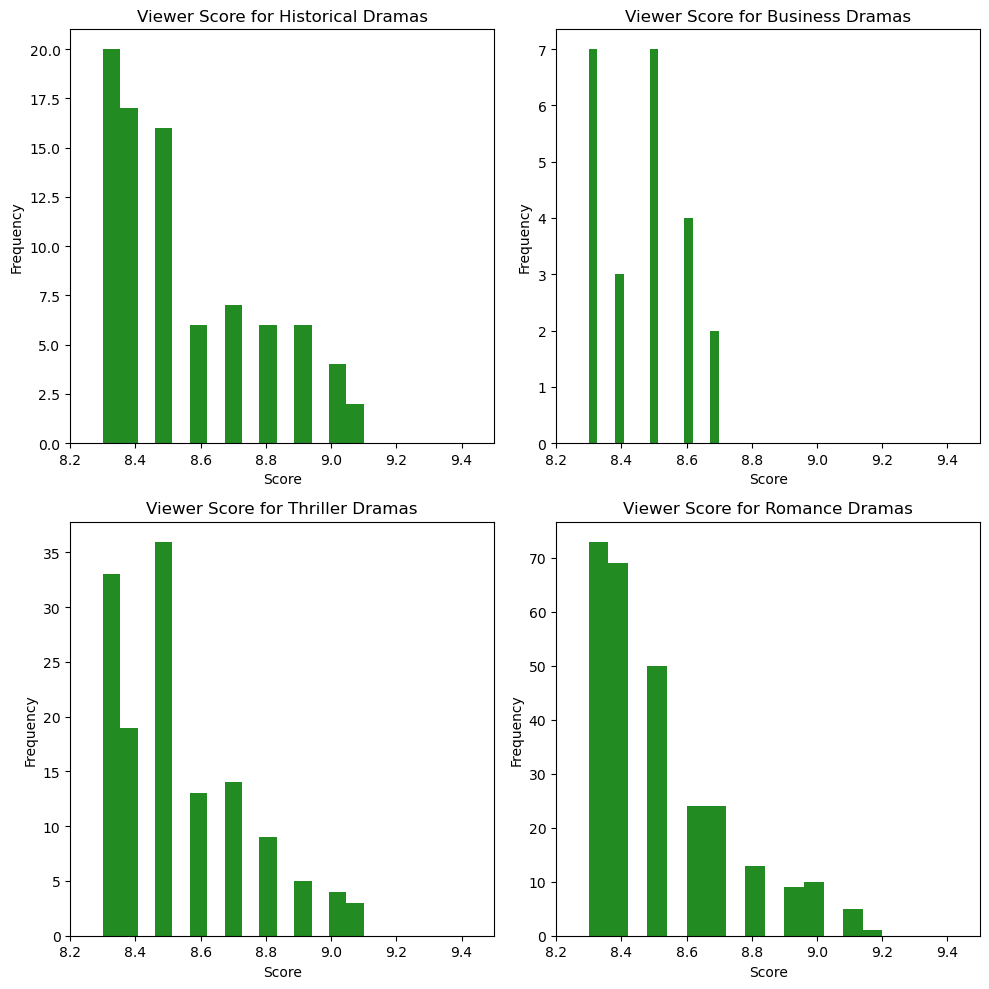
These graphs show that while there are differences in the genres, most of them have a similar range of scores. Business dramas (for example, a show about an office romance, or about a CEO) seem to have the lowest ratings, with none rated above 8.7.
What’s the most popular genre?
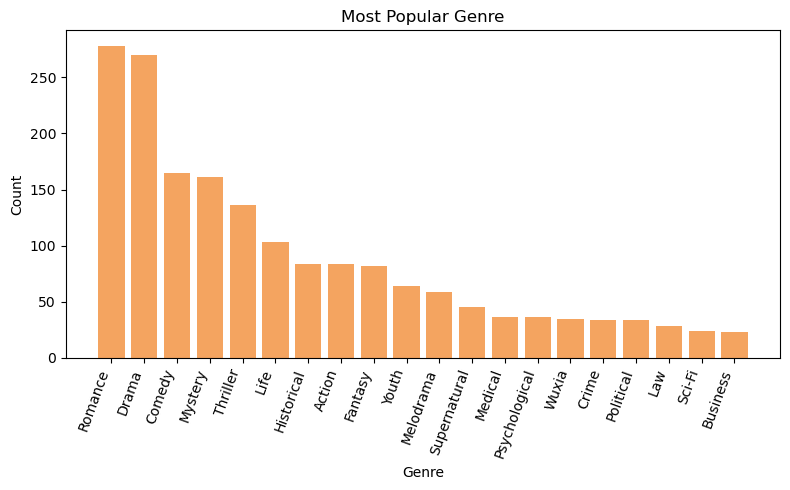
Romance and Drama are the most popular genres. This is expected. However, mystery and thriller were some of the next most popular, which I found surprising. (Note: data was filtered to include genres with at least 20 occurences)
How do viewer scores compare across streaming platforms?
Are some streaming services more worth it than other? How does average score compare across the four most popular streaming services?
Note: Since these dramas originate in Asia, a lot of these streaming services are more popular in Asia (which is why you probably haven’t heard of most of them).
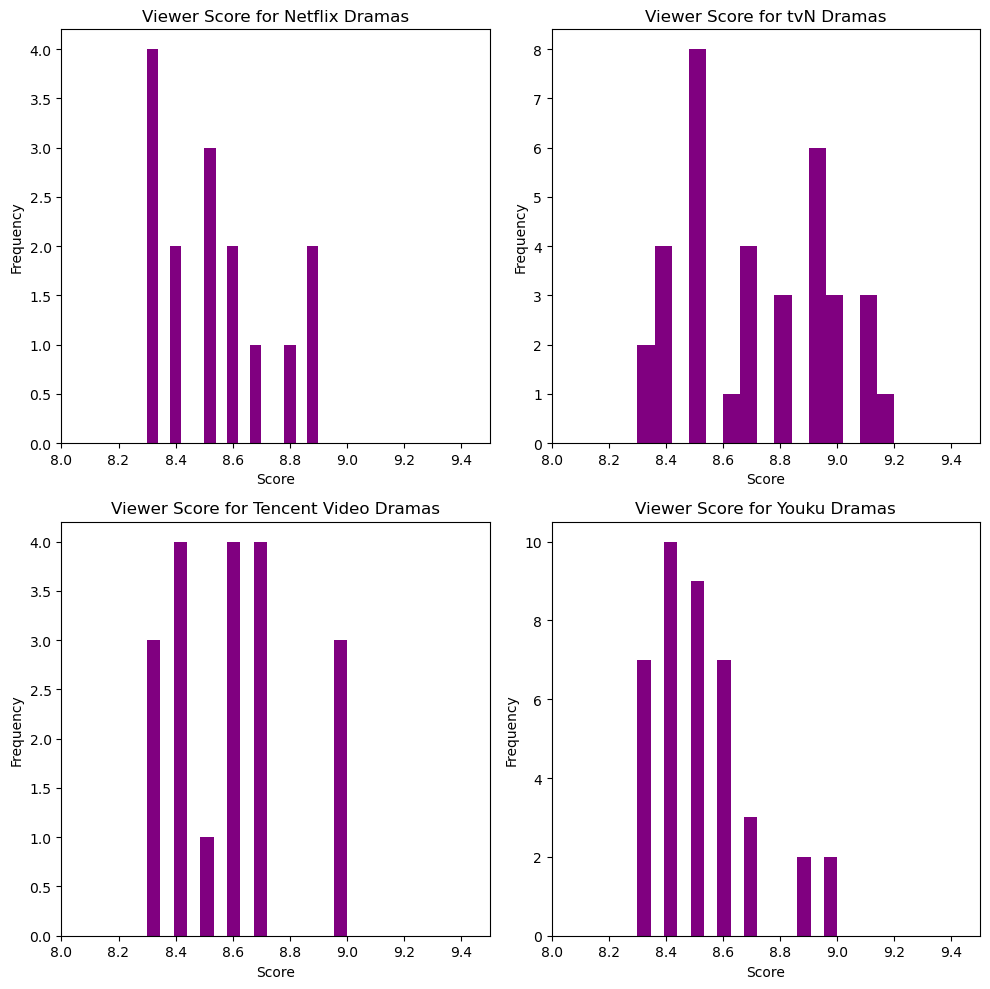
Once again, there doesn’t seem to be a significant difference between these four popular services. tvN has the highest scores around 9.2, but this isn’t enough to convince me to change my subscriptions.
What’s the most popular streaming service?
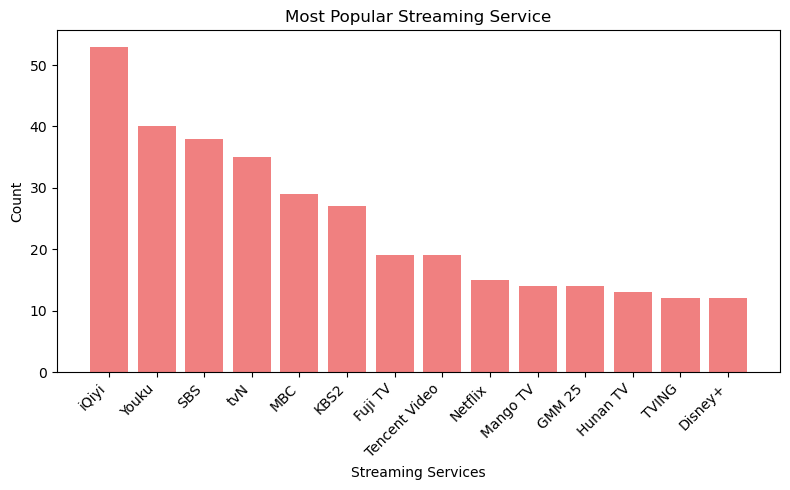
iQiyi, Youku, and SBS, and tvN had the highest number of dramas in the top 500. (Note: data was filtered to include networks with at least 12 occurences)
What’s the relationship between show length and viewer score?
Are long shows worth it? Should producers tack on extra seasons, or leave off with the more standard 12-20 episodes?
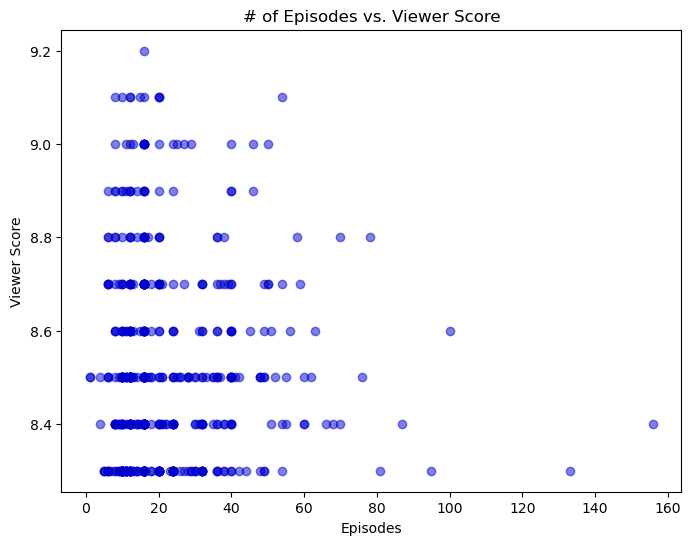
It appears that shows with more than 60 episodes have lower ratings. However, most shows have less than 20 episodes, and for that range, there doesn’t seem to be a clear relationship between number of episodes and overal score.
Did viewership increase during/after COVID-19?
I’m curious to know if more people started watching dramas during the pandemic when they had lots of time. I’m looking to see any significant changes around the years 2020 and 2021. In the graph below, ‘watchers’ denotes the number of streams that a particular show had. The higher the watchers, the more people there were watching the show.
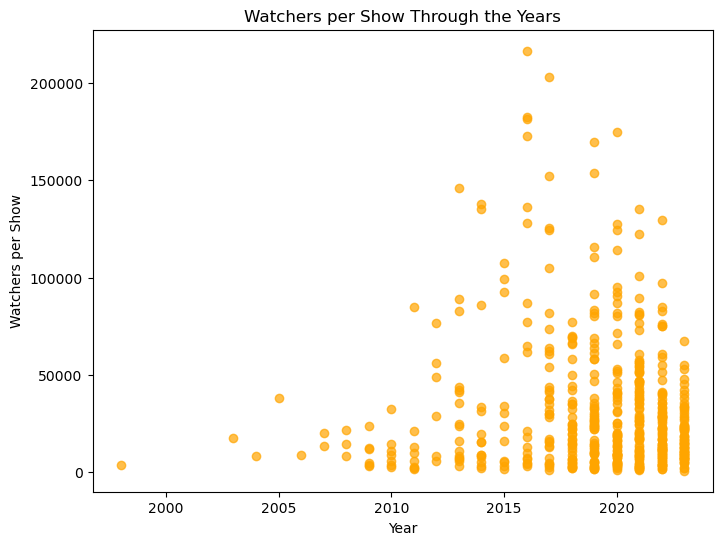
This shows us that the most watched dramas to date were made around 2015. However this doesn’t acount for shows that had lots of viewers, but haven’t had as many years to accumulate views. We see that more dramas were produced starting around 2019, but no siginifcant patterns have emerged around 2020.
Which country produces the best dramas?
I was originally going to see which country produced the most dramas in the top 500 shows, but Korea won by a landslide. So instead I looked to compare viewer score between countries.
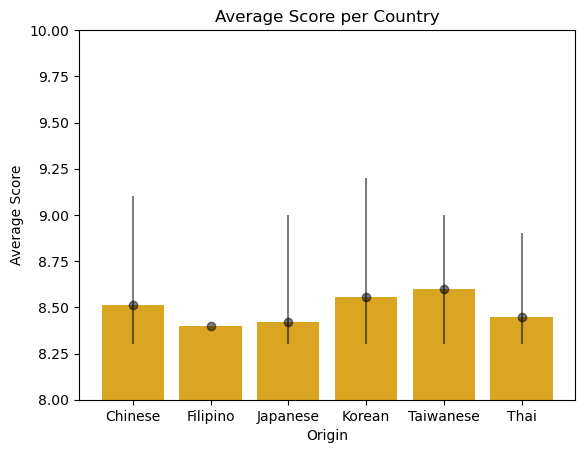
We see here that Korean Dramas and Taiwanese Dramas have the highest average scores for their dramas. The error bar denotes the min and max score in each country, so we see that Korea had the highest scoring show in the data set.
Conclusion
I hope these graphs were interesting! One of my favorite take-aways was seeing which genres were the most popular. I was surprised there were so few business genres in the top 500, and that their ratings were lower than the other genres, as I’ve enjoyed the one’s I’ve seen. I also found it interesting that thriller was one of the more popular genres. Most people probably associate dramas with romance and fluff, and don’t realize there’s several thrillers and mysteries!
To see the code for the above graphics, you can view my git repository here.
If you want to explore my fun and interactive dashboard for this dataset, check it out here: All the Drama